SEO forecasting is only useful when it ends in pipeline. Here is how SaaS teams build a ranged forecast from search demand to demos and ARR, with AI Overview discounts and a worked example.

Founder, Digital Gratified
SEO forecasting is the work of estimating what an organic program will produce before you fund it: how many visits, demo requests, opportunities and dollars of new ARR, over what timeline, within what range. For a SaaS company the useful forecast ends in pipeline, not traffic, and it is always a range with its assumptions written down, never a single promised number.
Most guides stop at search volume multiplied by click-through rate. That math was shaky before AI Overviews started absorbing clicks, and it ignores the months between publishing a page and closing the deals it sources. This guide covers the four forecasting methods, a model that runs from searches to ARR, how much to discount clicks for AI answers, a worked example on real keyword data, and how to present the result to a skeptical CEO.
What Is SEO Forecasting?
An SEO forecast is a model of future organic performance built from three kinds of input: demand (how many people search for the topics you want to rank for), visibility (where you can realistically rank, by when, and how many of those searchers will click), and conversion (how many of those visitors become leads, opportunities and customers).
A good forecast does three jobs: it shows which pages to build first, it ties the budget to an expected return, and it tells the board in month three that flat demo numbers are part of the plan.
It is not a guarantee. Google's own advice on hiring an SEO puts it bluntly: "No one can guarantee a #1 ranking on Google." A forecast that reads like a promise is a sales document. A forecast that shows its assumptions is a planning tool, and the planning layer of how SaaS SEO compounds into ARR.
Why Most SEO Forecasts Miss for SaaS Companies
Forecasts usually miss in one of four predictable ways, and each one hurts B2B software more than a retailer or a publisher.
They Forecast Traffic Instead of Pipeline
A forecast that ends in sessions invites the wrong plan. Glossary terms and broad how-to queries carry the biggest volumes, so a traffic forecast pushes budget toward them, even though a competitor alternatives page with a tenth of the traffic can produce several times the demos. We made the same argument in our guide to which B2B pages to build before awareness content: the pages closest to a buying decision are where SaaS pipeline comes from, and they are usually the easiest to rank.
They Assume Click Rates From Before AI Overviews
Most CTR curves in circulation describe a results page that no longer exists. When an AI Overview sits above the organic results, fewer people click, and a forecast that applies an old curve to those queries will overstate visits, sometimes by half or more.
They Ignore How Long Ranking Takes
New pages rarely rank quickly. One study of a random sample of a million new pages found that only 1.74% reached the top 10 within a year, and the average page in position one was five years old. Pages on established domains do far better than that sample, but the lesson holds: a forecast that books full traffic in month two is fiction.
They Ignore the Sales Cycle
A demo request in month six closes in month eight or nine, if it closes at all. Forecasts that convert visits straight into revenue in the same month make SEO look faster than it is, then make it look broken when the CFO compares the plan with booked ARR. Pipeline created and revenue closed need separate lines.
Four SEO Forecasting Methods, and When Each One Fits
The four common methods answer different questions, and most SaaS teams need two of them together.
| Method | How it works | Best for | Main weakness |
|---|---|---|---|
| Keyword-based (bottom up) | Search volume for each target keyword, times the CTR you expect at your likely position, times your conversion rates | New pages and new clusters, especially bottom of funnel pages | Depends on volume estimates and on guessing your future position |
| Historical trend (time series) | Projects past organic clicks forward, adjusting for seasonality, using regression or a model such as Prophet | Sites with a year or more of stable data that want a baseline for existing pages | Assumes the future looks like the past; blind to new pages and to Google updates |
| Competitor benchmark | Uses the estimated traffic of sites or pages that already rank as the ceiling for what you could win | Sizing the opportunity in a category before committing a budget | Third-party traffic estimates can be far off, and a competitor's authority may be years ahead of yours |
| Page-type cohort | Uses your own past pages of the same type (how many months to rank, what traffic, what conversion) to predict new ones | SaaS teams with at least five to ten published pages of each type | Needs history; small samples swing widely |
Our position: for a SaaS company, the keyword-based method should carry the forecast for anything new, calibrated against your own page-type cohorts as soon as you have them. Use a historical trend model only for the baseline you already own, so you can show the lift from new work separately. If you want to run a time series model, Ahrefs publishes a free Colab notebook that runs Prophet on traffic exports; the author's own advice is that more complex forecasts take more effort and "aren't necessarily better."
How to Build an SEO Forecast in Pipeline, Step by Step
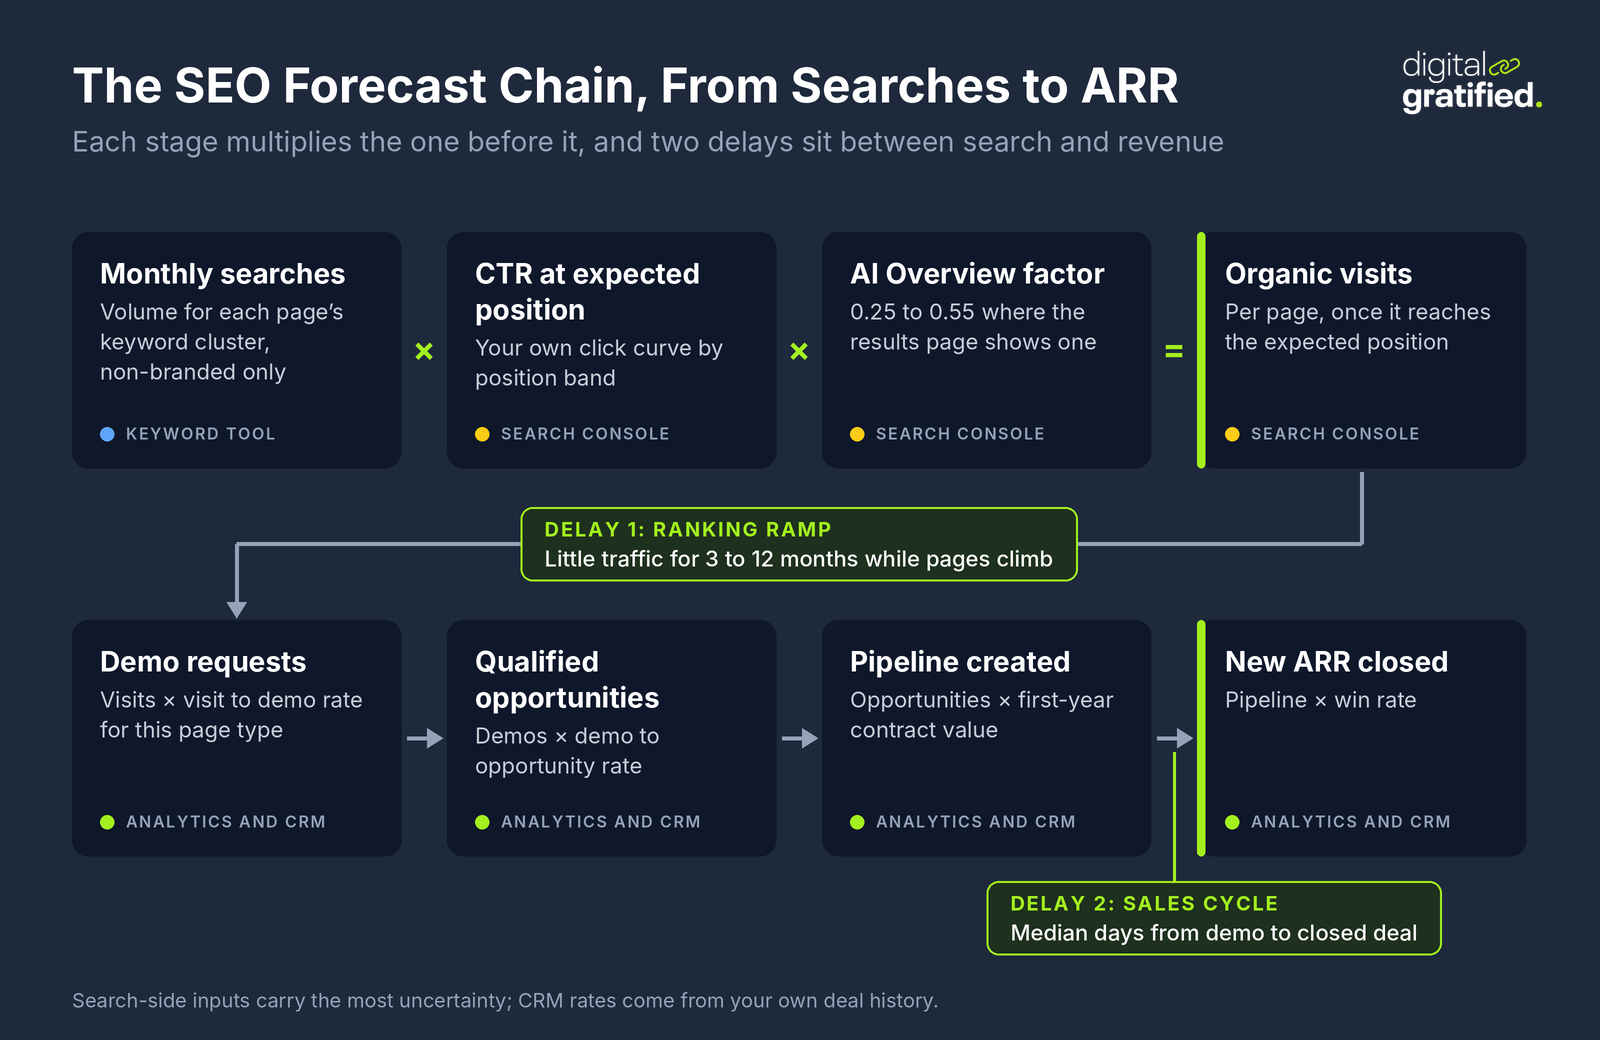
The model below is the one we use when we plan SaaS programs. Every number in it comes from one of three places: a keyword tool, your own Search Console and analytics data, or your CRM. The chain matters as much as the inputs, because each stage multiplies the error of the one before it.
Step 1: Group Keywords by Page, Not by Keyword
One alternatives page will rank for its head term and dozens of variants, so build the forecast around the pages you plan to publish, each with a primary keyword and a cluster of close variants. The traffic potential figure in keyword tools (what the current top page gets from all its keywords) is a useful sanity check on each page's total.
Keep branded and non-branded searches in separate rows. Branded demand mostly reflects marketing and sales activity elsewhere, and mixing it in makes SEO look either better or worse than it is.
Step 2: Set a Realistic Position and a Date for Each Page
For each page, decide the position you can realistically reach and the month you expect to reach it. Keyword difficulty gives a first read; the better test is to compare your page's likely authority with the pages already ranking. Our guide to the referring domain gap between you and the top results shows how to measure it.
Be conservative with timing. On a domain that already ranks for related terms, a low competition commercial page might take three to six months to settle; on a young domain, or against entrenched competitors, a year is more honest. If the site has crawl or indexing problems, fix them first, because no forecast survives pages Google cannot see. The crawl and indexing fixes SaaS sites usually need come before any of this math.
Step 3: Use Your Own Click Curve, Then Discount for AI Answers
Build a CTR curve from your own Search Console data: export clicks and impressions by query, group by average position, and calculate CTR for each position band. Search Console's date filter goes back 16 months, which is enough to see a full year of seasonality.
One warning before you do. Google has confirmed that a logging error prevented Search Console from accurately reporting impressions from May 13, 2025 until April 27, 2026. Impressions, CTR and average position from that window are unreliable; clicks were not affected. Build your curve from data after April 27, 2026, or from clicks alone, and do not use that window as a baseline for a trend model without adjusting for it.
Then apply a separate discount for queries that show an AI Overview, which we cover in the next section. Keyword tools flag which results pages include one.
Step 4: Convert Visits Into Demos, Opportunities and ARR
Use conversion rates by page type, from your own analytics and CRM. An alternatives page and a glossary post do not convert at the same rate, and a single site-wide average will flatter the glossary and undersell the comparison page. You need four rates: visit to demo or trial request, request to qualified opportunity, opportunity to closed deal, and average first-year contract value.
Track the organic landing page on every form submission, or you cannot check the forecast later; our guide to attribution without false precision explains how to set it up without overclaiming.
Step 5: Add the Time Lags
Add two delays. The first is the ranking ramp from Step 2: no meaningful traffic for the first few months, then a partial month or two before the page reaches its expected position. The second is your sales cycle: the median number of days from demo request to closed deal, taken from the CRM. A forecast with both lags shows pipeline building from month four or five and closed ARR arriving after that, which is how SEO revenue shows up in a CRM.
Step 6: Give a Range With Three Scenarios
Build low, base and high cases by varying only the inputs you are unsure about: CTR at your expected position, the AI Overview discount, and visit to demo conversion. Keep the CRM rates you know well (opportunity rate, win rate, contract value) fixed across scenarios, so the range reflects search uncertainty rather than sales optimism.
How Much to Discount Clicks for AI Overviews
Every serious study of AI Overviews finds that they take clicks from the organic results. The studies differ in method, sample and date, so no single number is right, but together they give a sensible range. In a panel of 900 U.S. adults, people clicked a traditional result on 8% of visits to pages with an AI summary, against 15% without one. Across 3,119 informational queries, organic CTR was 0.61% with an AI Overview and 1.62% without in September 2025. A 300,000-keyword analysis found that an AI Overview correlated with a 58% lower CTR for the top-ranking page. The newest U.S. figures, from Q2 2026, show desktop positions one and two drawing 29.05% of clicks without an AI Overview and 10.04% with one, while position one on mobile fell from 35.95% to 8.51%.
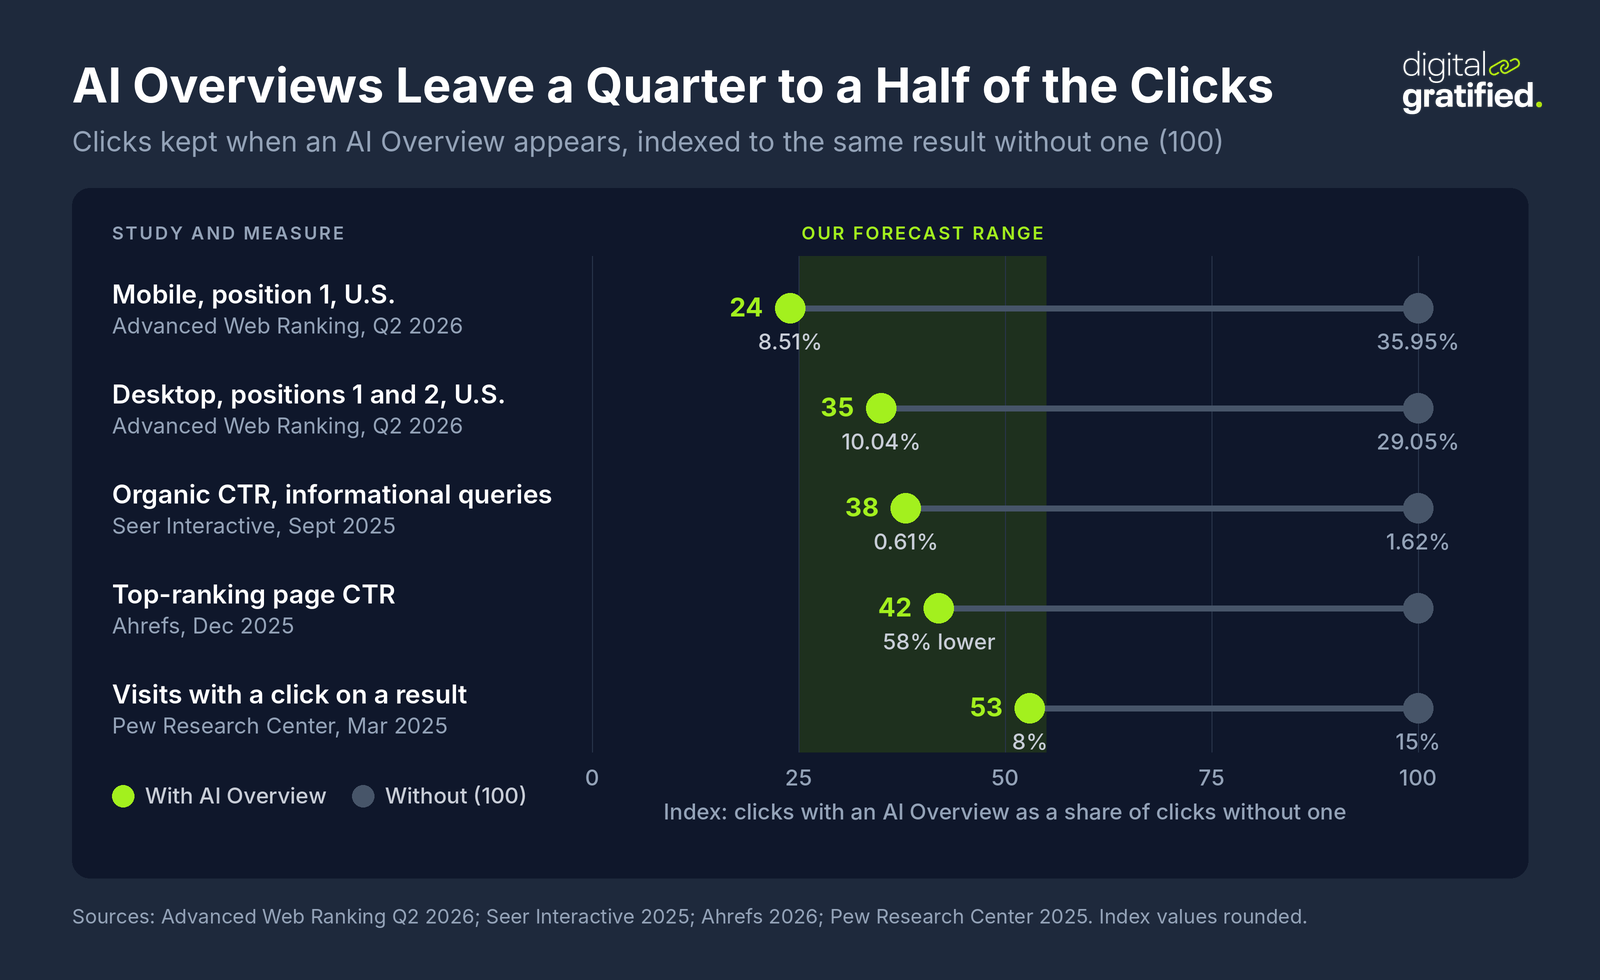
Put another way, a page on a results page with an AI Overview keeps somewhere between a quarter and a half of the clicks it would otherwise get. Two details matter for SaaS forecasts. Most of these studies lean toward informational queries, and comparison or alternatives searches from buyers may lose less. And being cited inside the AI Overview helps: the 3,119-query study measured 35% higher organic CTR for cited brands than for brands that were not cited, though its authors note that correlation is not proof of cause.
Our rule of thumb: on any query where your keyword tool shows an AI Overview, multiply your normal CTR by 0.4 in the base case, 0.25 in the low case and 0.55 in the high case, and revisit those factors every quarter with your own Search Console data. Then work on the other half of the problem, getting cited in AI answers for the queries your buyers ask, because a citation is the one lever that improves the factor itself.
A Worked Example: Forecasting a Cluster of Alternatives Pages
Here is the model applied to a hypothetical help desk software company planning four competitor pages. The search volumes, difficulty scores and costs per click are real Ahrefs data for the United States; every conversion rate after that is an assumption you should replace with your own.
| Keyword | US searches per month | Keyword difficulty | CPC | AI Overview on the results page |
|---|---|---|---|---|
| freshdesk alternatives | 1,700 | 4 | $35.00 | Yes |
| intercom alternatives | 1,500 | 3 | $14.00 | Yes |
| zendesk alternatives | 1,100 | 1 | $50.00 | Yes |
| zendesk vs freshdesk | 700 | 6 | $55.00 | Yes |
Advertisers pay $14 to $55 a click for these searches, so buyers with budget are behind them, and every one of the four results pages shows an AI Overview, so the discount applies to the whole cluster.
Now the forecast, using 5,000 combined monthly searches and counting only the four head terms (the pages will also rank for variants, which makes this conservative). We assume a 50% demo to opportunity rate, a 25% win rate and a $12,000 first-year contract value in every scenario. For timing, we assume no traffic until month four, half of full traffic in months four and five, full traffic from month six, and a 60-day sales cycle.
| Input or output | Low | Base | High |
|---|---|---|---|
| CTR at expected position, before AI Overviews | 4% | 6% | 8% |
| AI Overview factor | 0.25 | 0.40 | 0.55 |
| Monthly visits once ranking | 50 | 120 | 220 |
| Visit to demo request | 2% | 3% | 4% |
| Demo requests per month | 1.0 | 3.6 | 8.8 |
| Qualified opportunities per month | 0.5 | 1.8 | 4.4 |
| New ARR per month once ranking | $1,500 | $5,400 | $13,200 |
| Pipeline created in year one | $48,000 | $172,800 | $422,400 |
| New ARR closed in year one | $9,000 | $32,400 | $79,200 |
Read the table the way a CFO would. In the base case, four pages with 120 visits a month between them produce $172,800 of pipeline and $32,400 of closed ARR in year one, then about $5,400 of new ARR every month after that. A traffic forecast would have reported 120 visits and made the project look trivial. A forecast without lags would have booked twelve months of revenue instead of six.
The range is wide, and that is the point: it comes almost entirely from three search-side assumptions, so measure real CTR and conversion on these pages first and narrow the range by month six.
Recent Changes That Affect Your Forecast Inputs
Third-party rank and volume data may lag. Since around September 13, 2026, Google appears to be blocking more scrapers and tracking tools, and some providers are collecting far less data. Cross-check any recent movement in a keyword tool against your own Search Console clicks before you change a forecast.
The September 2026 spam update finished on October 8. It ran from September 24 to October 8, 2026, and it does not target link spam. If your baseline includes those two weeks, annotate them, and look at the pages that moved before you treat the change as a trend.
Position reporting for AI features is still changing. Google's John Mueller said on September 16, 2026 that position and impression tracking for AI Mode and AI Overviews will "evolve over time". Until it settles, forecast and report on clicks and conversions, and treat average position for AI-heavy queries as a rough signal.
How to Present an SEO Forecast to Your CEO or Board
Lead with the decision the forecast supports. One page is enough: the range for pipeline created and ARR closed over twelve months, the investment it assumes, and the three assumptions that move the number most. For the example above, those are the AI Overview factor, the visit to demo rate and the ranking date.
Agree on leading indicators by quarter at the same time, so nobody judges a twelve-month plan on month-three revenue: indexation and target positions in the first quarter, clicks and demo requests in the second, opportunities from the third. Our guide to a monthly SEO report built around pipeline shows the format, and the same numbers turn a forecast into an SEO budget when finance asks what the spend should be.
This is how we work on the SaaS SEO programs we run for clients: the audit and strategy phase maps a keyword and link roadmap to a revenue goal, and monthly reporting shows what was built, what moved and what it means for pipeline. The forecast is what lets both sides agree on success before the work starts.
How to Track Forecast Accuracy and Re-Forecast Each Quarter
A forecast is a hypothesis, so test it. Every quarter, compare forecast and actual for each page on three numbers: position, clicks and demo requests. Where they differ, the pattern tells you which assumption failed.
- Positions on plan, clicks below plan: your CTR or AI Overview factor was too high. Update the factor from Search Console, and check whether the page is cited in the AI answer.
- Clicks on plan, demos below plan: the page attracts the right searches but does not convert. Fix the page before buying more traffic for it.
- Positions below plan: the page needs more authority, better content or a technical fix. Check the referring domain gap and the indexing status before rewriting.
- Everything on plan, ARR below plan: the issue is downstream of SEO. Look at lead routing, demo show rates and sales follow-up.
Then roll the forecast forward: replace assumed rates with measured ones, move pages that ranked into the baseline, and add the next cluster. After three or four quarters you have page-type cohorts of your own, and a page that misses its forecast is the fastest way to spot the SaaS SEO mistakes that quietly stall growth.
The Bottom Line
An SEO forecast earns its place when it ends in pipeline, shows a range and states its assumptions. Build it page by page from real search demand, discount clicks for AI Overviews, add the ranking ramp and your sales cycle, and keep pipeline created separate from ARR closed.
Then treat it as a living model: measure CTR and conversion on the first pages that rank, replace the guesses, and re-forecast every quarter. If you want a forecast built from your own Search Console and CRM data, plan your SaaS SEO forecast with us.
Frequently Asked Questions
What is SEO forecasting?
SEO forecasting is estimating what an organic search program will produce before you invest in it: visits, leads, opportunities and revenue over a set period. A useful forecast is a range with its assumptions written down, built from search demand, realistic click rates and your own conversion data.
How accurate are SEO forecasts?
No SEO forecast is exact, because rankings, click rates and search features change. Accuracy improves when you forecast by page rather than by keyword, use your own Search Console click curve and CRM conversion rates, give low, base and high scenarios, and re-forecast every quarter with measured results.
How do you forecast SEO traffic?
Multiply the monthly search volume for each page's keyword cluster by the click-through rate you expect at the position you can realistically reach, then discount queries that show an AI Overview. Add a ramp for the months the page needs to reach that position, and check the total against the traffic of pages that already rank.
How do AI Overviews affect SEO forecasts?
They lower the clicks a ranking page receives. Published studies put the clicks kept at roughly a quarter to a half of what the same result gets without an AI Overview. Apply a separate factor to queries that show one, and update it from your own Search Console data each quarter.
How far ahead should an SEO forecast go?
Twelve months is the most useful horizon for budget decisions, with quarterly checkpoints. New pages often need several months to reach their expected position, and B2B deals take further weeks or months to close, so a shorter forecast mostly shows the delay rather than the result.
How do you forecast SEO for a new website with no data?
Use the keyword-based method with conservative assumptions: lower positions, slower ramps and conversion rates from your other channels or from sales data. Benchmark against competitors' ranking pages to size the ceiling, then replace assumptions with real figures as soon as your first pages rank.
What is the best SEO forecasting tool?
For most SaaS teams a spreadsheet is enough, fed by a keyword tool for search volume, Search Console for click-through rates and the CRM for conversion and deal values. Time series tools and notebooks help when you have a long, stable traffic history to project forward.
About the author
Let's Scale Your SaaS Together
Get a custom SEO and link building strategy tailored for your SaaS business.
Get SEO insights that actually move rankings
Link building tactics, case studies, and SaaS SEO playbooks. No fluff, no spam.
You're subscribed!
SEO and link building insights, straight to your inbox.